Hypervision, a one-of-a-kind interface for 360° building management
With the development of the smart building, new sources of data (geolocation, IoT, surveillance, etc.) are appearing. As FMers, we played a role in breaking down the silos dividing up this mass of information so as to offer our customers better services.
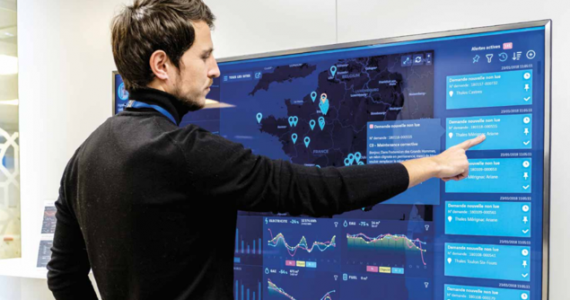
With this goal in mind, the VINCI Facilities developed hypervision, a real-time management and adjustment tool covering services across all our sites via a single interface.
How does it work?
Hypervision does not replace existing tools. It constitutes a single point of entry providing access to all data contained in VINCI Facilities software:
View full screen here
It provides a macroscopic view of this data, enabling our maintenance teams to locate and analyse full information in just a few clicks. By anticipating anomalies and complaints, hypervision enables teams to be more proactive and detects the need for maintenance work before the customer does.
How is it structured?
The interface is designed for local (supervision) or comprehensive (hypervision) use, for both single and multiple sites. Locally, it provides a large number of very precise activity indicators spread across about 20 screens. Comprehensively, the general indicators, categorised by theme, are disseminated in a single screen.
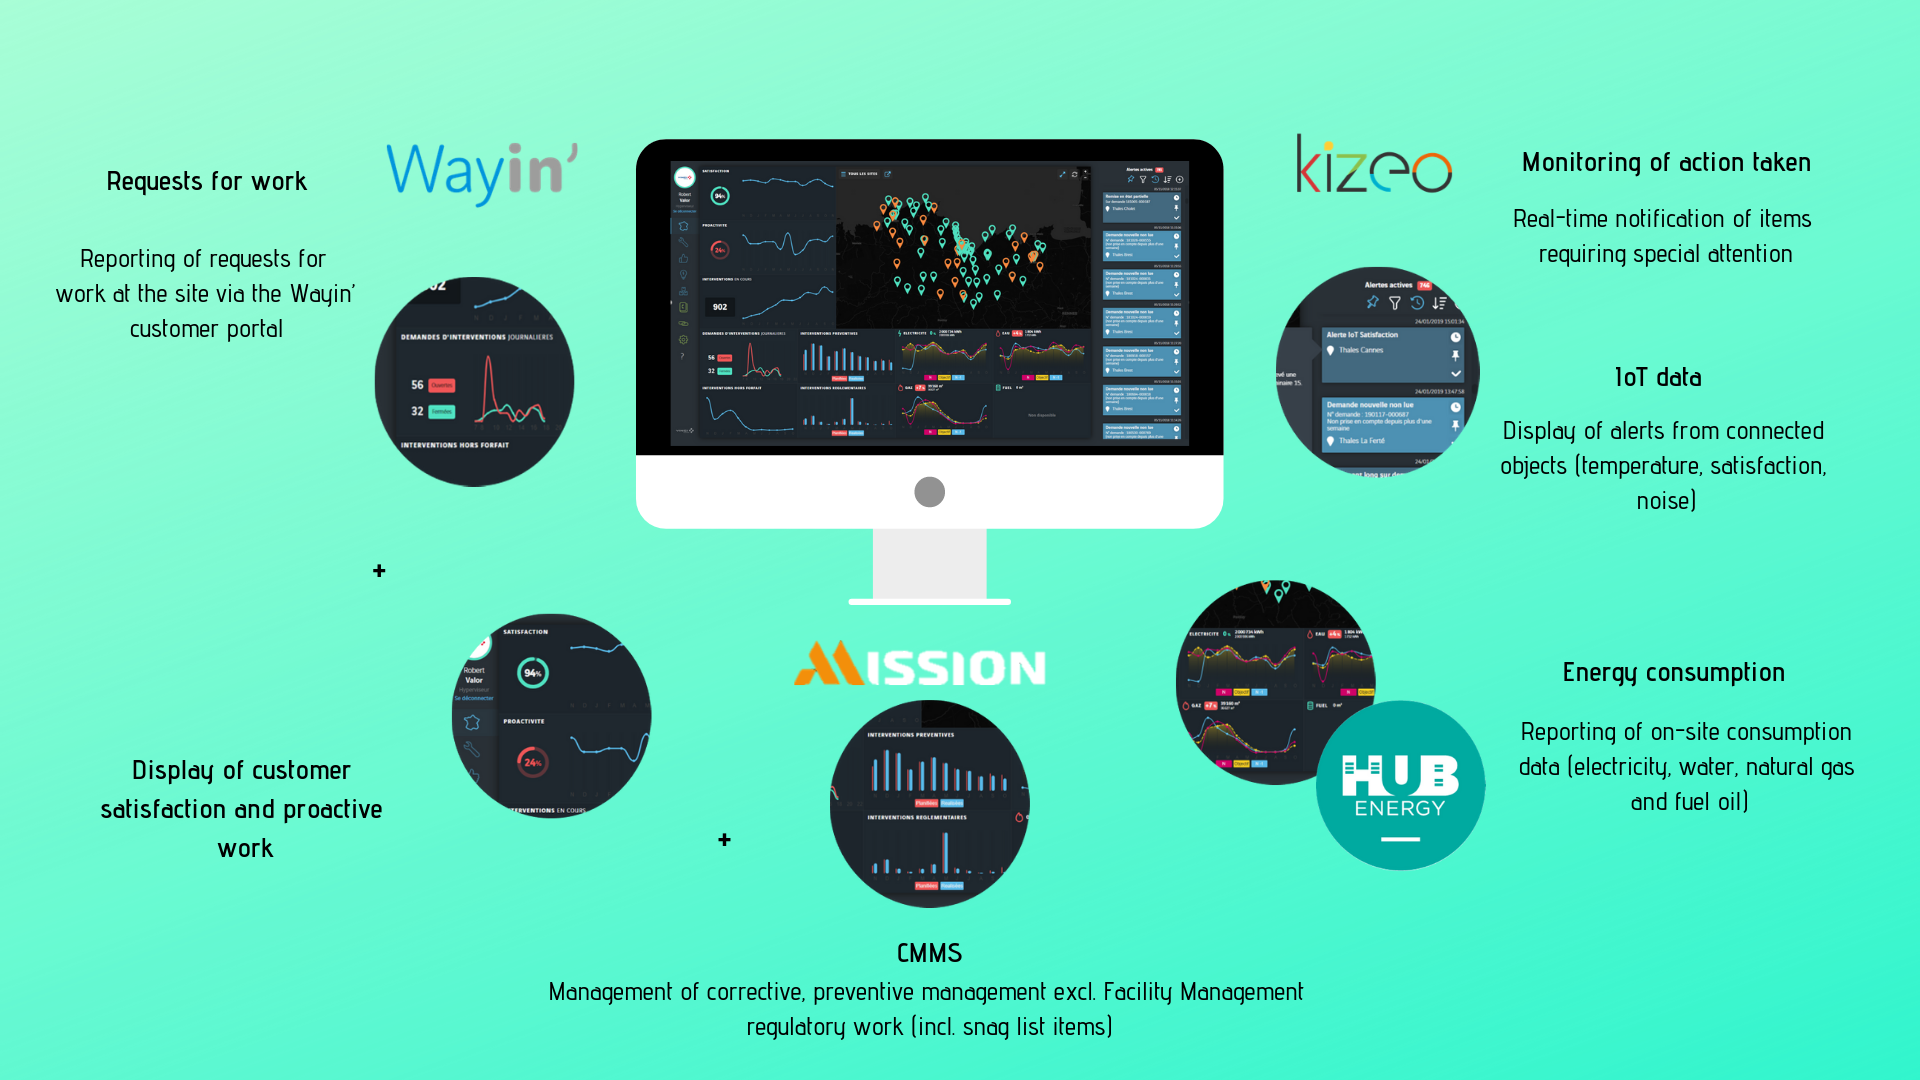
The main hypervision interfaces are:
♦ Preventive/corrective maintenance work: real-time display of maintenance work under way, with views of technician assignments by site. Progress and contractual timeline compliance meters for each type of maintenance work.
♦ Regulatory inspections and snag lists: display of current, delayed and upcoming inspections. Tracking of snag list resolution within contractual deadlines.
♦ Satisfaction and proactive maintenance: satisfaction meters and customer comment reporting. Tracking of the number of anomalies resolved.
♦ Energy: reporting of consumption data (gas, water, electricity) in three separate curves showing consumption for the previous year, the current year and the objective set by the customer.
♦ Inventory: search for critical parts at neighbouring sites.
♦ Expert directory: keyword and geographical search for experts. Automatic suggestion of the experts best able to help the maintenance technician for each job.
Benefits for our customers:
Hypervision has currently been activated at 2,200 sites for 35 customers (Thales, BioMerieux, Crédit Agricole, La Poste, Groupama etc.). It provides practical benefits:
- Improved end user comfort thanks to creation of alerts
- Greater responsiveness thanks to the identification of possible malfunctioning systems or consumption discrepancies and highlighting of the proactivity indicator
- Better adaptation of our services to actual use, based on an analysis of building occupation and operation
- Better overview of operation, with proposals for improvement plans
What applications will be coming up in future?
Hypervision operates a company bus. It works like a “marshalling yard” for the data flowing between all our IT tools.
Hypervision thus provides a wealth of information on the evolution of smart buildings. Data knowledge and control opens good prospects for the future, notably in the consulting market with our partners.
Lastly, hypervision is part of a broader IT project, the Building Data Factory, a secure data management and analysis system that is used to improve management of all technical and service activities and to ultimately provide a better choice of building installations and support the creation of new activities beyond Facility Management that are related to other VINCI Energies and VINCI business activities.
Did you like the article ?